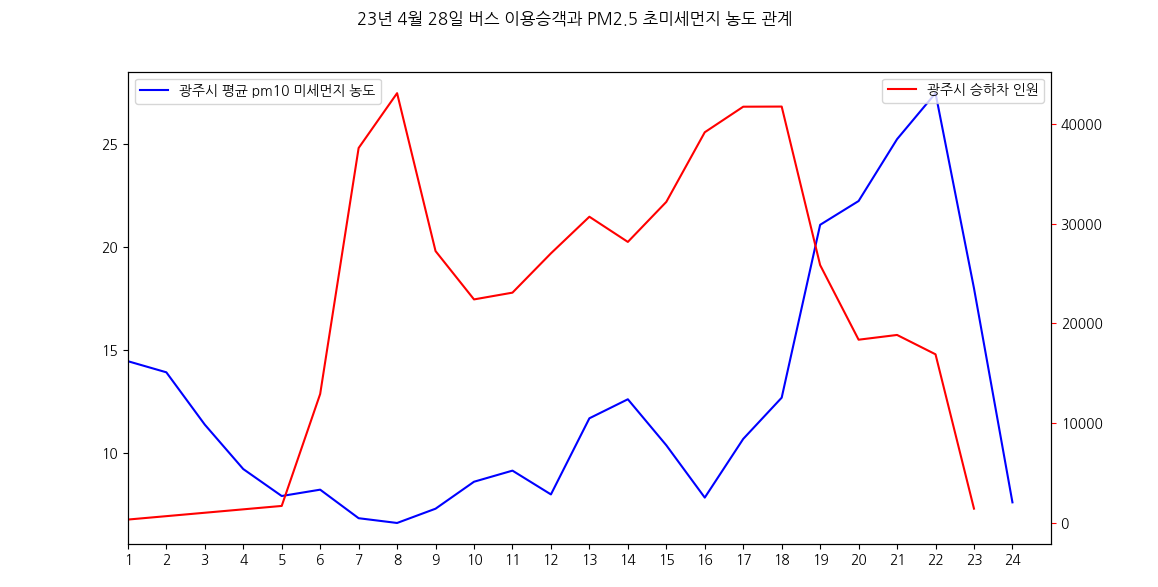
matplotlib 한글 폰트 적용, 데이터 시각화 [2023-05-31 학습일지]
matplotlib는 설치 직후 상태에선 한글을 지원해주지 않는다.

그래서 우리는 matplotlib의 폰트에 한글 폰트를 추가해주고(1) 기존의 font 캐시를 삭제해주고(2), 기본 폰트를 한글 폰트로 설정해주는 작업(3)을 거쳐야한다.
(최종 결과물)

1. 우선은 venv 가상환경 matplotlib에 fonts 폴더에 우리가 추가하고자하는 한글폰트를 복사한다.


2. 그다음 user (사용자) 폴더에 있는 .matplotlib 폴더에서 fontlist-(~~).json 파일을 지워준다.

3. 그리고, 아까 가상환경 내의 matplotlib 폴더의 mpl-data 폴더에서 matplotlibrc 를 메모장으로 열어준 뒤, font.family를 검색하고, 사용하고자 하는 폰트 이름을 입력한다.


순서는 상관없다. 3가지 조건을 달성하면 기본으로 이제 한글이 적용된다.
다음은 pandas로 겪은 에러상황이다. 미세정보 데이터를 가져오기 위해 에어코리아(환경부 산하 한국환경공단)에서 필요로하는 대기정보를 엑셀로 저장했다.


PM10의 데이터는 ten이라고 prefix를 붙여주었다.
확장자가 xls지만 pandas의 read_excel 함수로 잘 열렸기에 전혀 문제될 것 없는 것처럼 보였다.
하지만, pandas 로도 열리지 않고, engine을 이것저것 바꾸어봐도 dataframe으로 열리지 않는 문제가 발생했다.

한참을 찾아보아도 방법이 없던 중에, 이곳을 통해 해결 방법에 대한 실마리를 얻었다.
사내망 엑셀파일에 걸린 자물쇠를 뚫고 코딩하기
엑셀 자동화 (1) - xlwings 라이브러리 시작하기
maeng-gun.github.io
xlwings도 안먹힘. -> 다른 spreadsheet 프로그램으로 저장한다 -> LibreOffice 설치 -> 새로 xlsx 로 저장해보는 시도 끝에 판다스로 dataframe 객체를 만드는데 성공했다!
굳이 libreoffice를 설치할 필요 없이 excel 파일의 metadata로 인한 문제인 것 같았다. 따라서, 필요한 데이터만 웹 스프레드시트로 옮겨서 따로 xlxs 파일로 저장해도 정상적으로 dataframe을 만들었다.
그래서 만든 데이터는 다음과 같다.
def get_avg_pollution_from_air_by_date():
    conn = sqlite3.connect("sample_bus_info_2.db")
    c = conn.cursor()
    result_list = c.execute("""
        select
         avg(time_1) as '1',
         avg(time_2) as '2',
         avg(time_3) as '3',
         avg(time_4) as '4',
         avg(time_5) as '5',
         avg(time_6) as '6',
         avg(time_7) as '7',
         avg(time_8) as '8',
         avg(time_9) as '9',
         avg(time_10) as '10',
         avg(time_11) as '11',
         avg(time_12) as '12',
         avg(time_13) as '13',
         avg(time_14) as '14',
         avg(time_15) as '15',
         avg(time_16) as '16',
         avg(time_17) as '17',
         avg(time_18) as '18',
         avg(time_19) as '19',
         avg(time_20) as '20',
         avg(time_21) as '21',
         avg(time_22) as '22',
         avg(time_23) as '23',
         avg(time_24) as '24'
         from air_pollution where measured_type = 'pm2.5' and date = '20230428' group by date;
        """, ).fetchone()
    conn.commit()
    conn.close()

    return list(range(1,25)), result_list

def get_data_by_all_bus_transaction():
    conn = sqlite3.connect("sample_bus_info_2.db")
    c = conn.cursor()
    list_x = list()
    list_y = list()
    result_list = c.execute("""
        select measured_time, sum(transaction_count) from tb_bus where date = '20230428' group by date, measured_time;
        """).fetchall()
    for row in result_list:
        list_x.append(row[0])
        list_y.append(row[1])
    conn.close()

    return list_x, list_y
오늘도 데이터 시각화를 만들어보는 연습을 진행했습니다.
감사합니다.